Greetings. I am a second-year Computer Engineering student from National University of Singapore (NUS). This document showcases the features I did for my Software Engineering Project, as well as the relevant sections I added to the User and Developer Guides.
Overview
About the Project
FOP Manager is a desktop Address Book application made for Project Directors organizing the NUS School of Computing Freshman Orientation Program (FOP). The user interacts with it using a CLI, and it has a GUI created with JavaFX. It is written in Java, and has about 10 kLoC.
My roles
I was in charge of the UI aspect of the application, and designed and implemented the Statistic and Save feature. The following section will describe these enhancements in more details, as well as showcasing all the relevant sections I have added to the user guide and developer guides in relation to these enhancements.
Please take notes of the following icons and their meanings used in the document:
command | Grey highlight indicates that this is a command that can be inputted into the command line and executed by the application.
Summary of contributions
-
Major enhancement: implemented the
statandsave_ccommand-
What it does: The
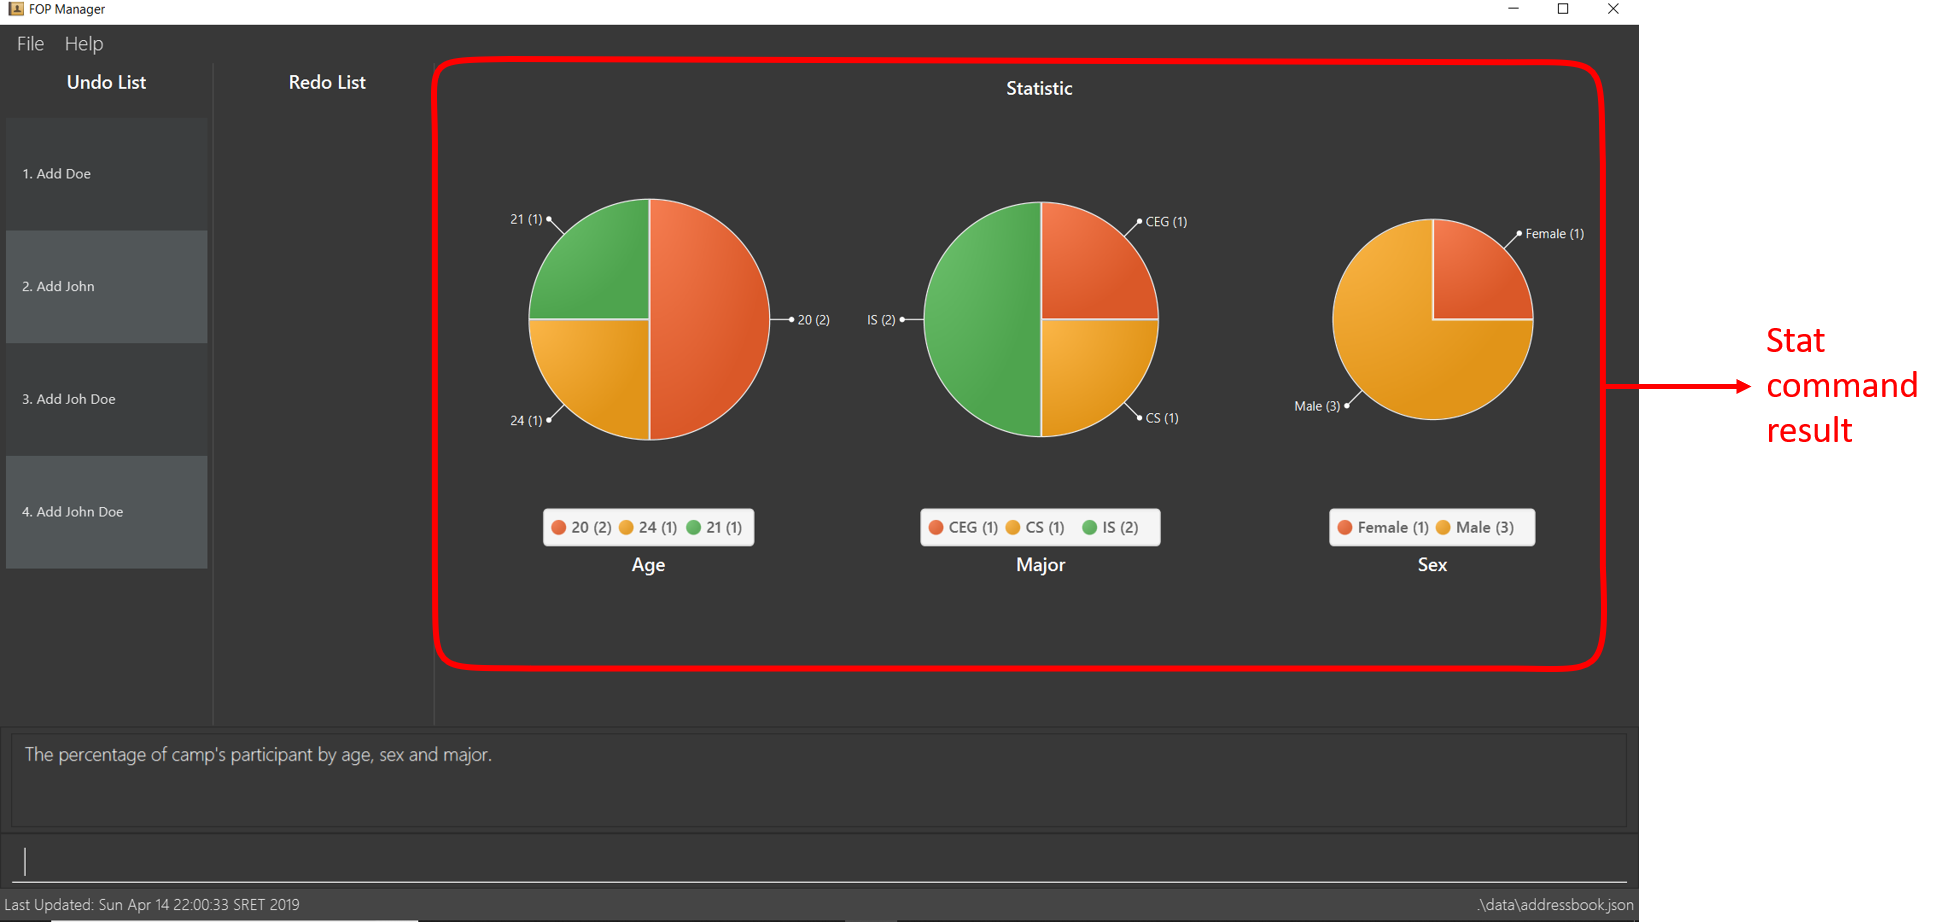
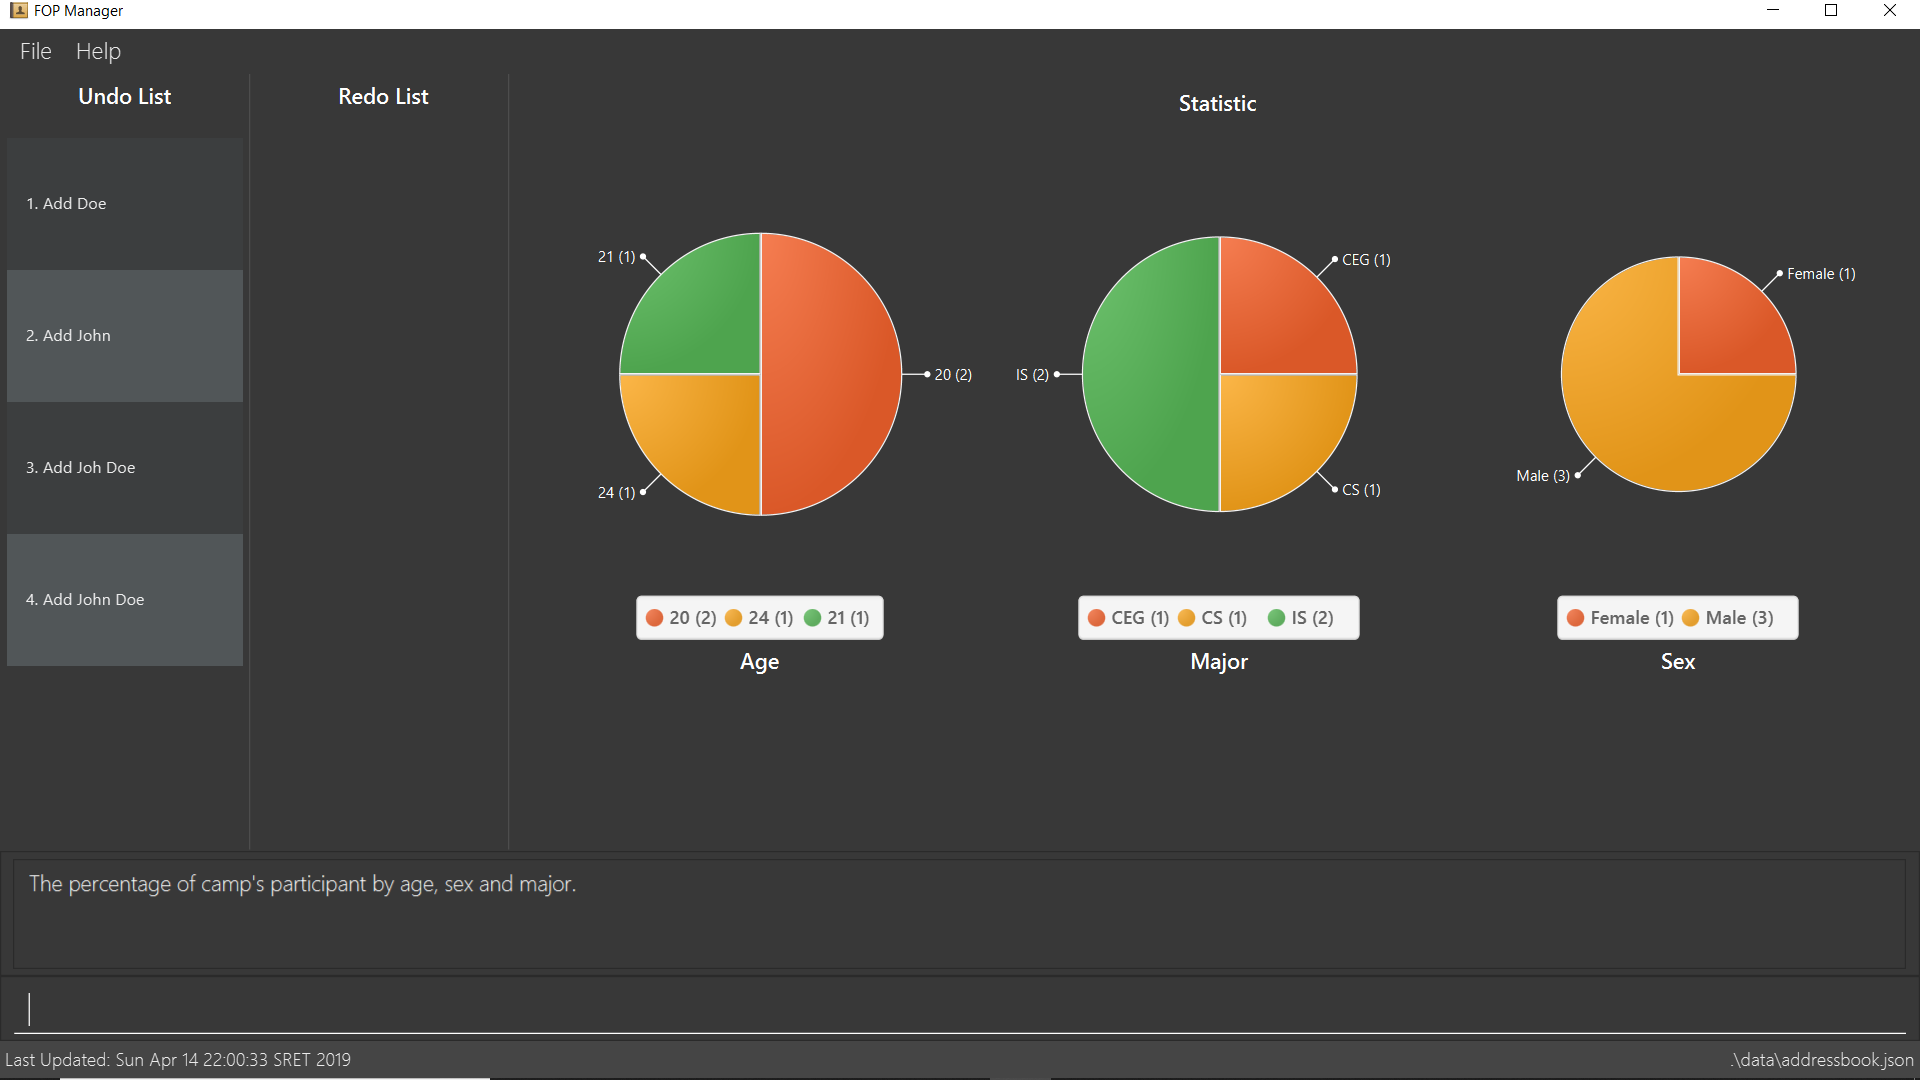
statcommand will generate three pie charts of all of the camp’s participants' age, major and sex and display them on the GUI as in Figure 1. Thesave_ccommand will save those charts into separate image files. -
Justification: At the end of every FOP, the Project Directors usually have to make various reports for their university, their faculty or different sponsors that requires these information. These two features together will let the user generate those data quickly and efficiently.
-
Highlights: This enhancement touched on the logic, model ,and UI components. A new
CustomPieChartclass was created to improve code readability. -
Code contributed: Pull Request #75
-
Credits: Some parts of the
statcommand was inspired by Part 6 of the excellent Java FX Tutorial by Marco Jakob.
-

-
Other contributions:
-
Project management:
-
Make a mock release for mid v1.3 to prepare for the real one
-
-
Community:
-
Review and merge various pull requests from team members
-
Help other teams with their UI component
-
-
Enhancements to existing features:
-

-
Code contributions:
-
Functional code: [Stat Command], [Save Chart Command], [Chart Panel], [Undo List Panel],
-
Test code: [Stat Command Test], [Save Chart Command Test], [Undo List Panel Test],
-
Feel free to check out all of my code on the Project Code Dashboard here
-
Contributions to the User Guide
Given below are sections I contributed to the User Guide. They showcase my ability to write documentation targeting end-users. |
Show camp participants' statistic: stat
Show the camp participants' statistic base on age, major and sex in the form of pie charts
Format: stat
Examples:
-
add_o n/John Doe s/M b/27071999 p/98765432 e/johnd@example.com m/Information System g/ -
add_o n/Joh Doe s/F b/27071998 p/98765432 e/johnd@example.com m/ceg g/ -
add_o n/John s/M b/27071995 p/98765432 e/johnd@example.com m/Information System g/ -
add_o n/Doe s/M b/27071999 p/98765432 e/johnd@example.com m/cs g/
Add some sample data to the application -
stat
The output is shown below:

Save statistic pie charts to images: save_c
Save the pie charts generated by the stat command to image files
Format: save_c [FILE NAME]
Examples:
-
stat -
save_c For NUS
Save the charts to image files with the name "For NUS"
Contributions to the Developer Guide
Given below are sections I contributed to the Developer Guide. They showcase my ability to write technical documentation and the technical depth of my contributions to the project. |
Statistic feature
The 'stat' command allows FOP Manager users to view the statistic of camp participants regarding their age, major and sex in a graphical manner.
Current Implementation
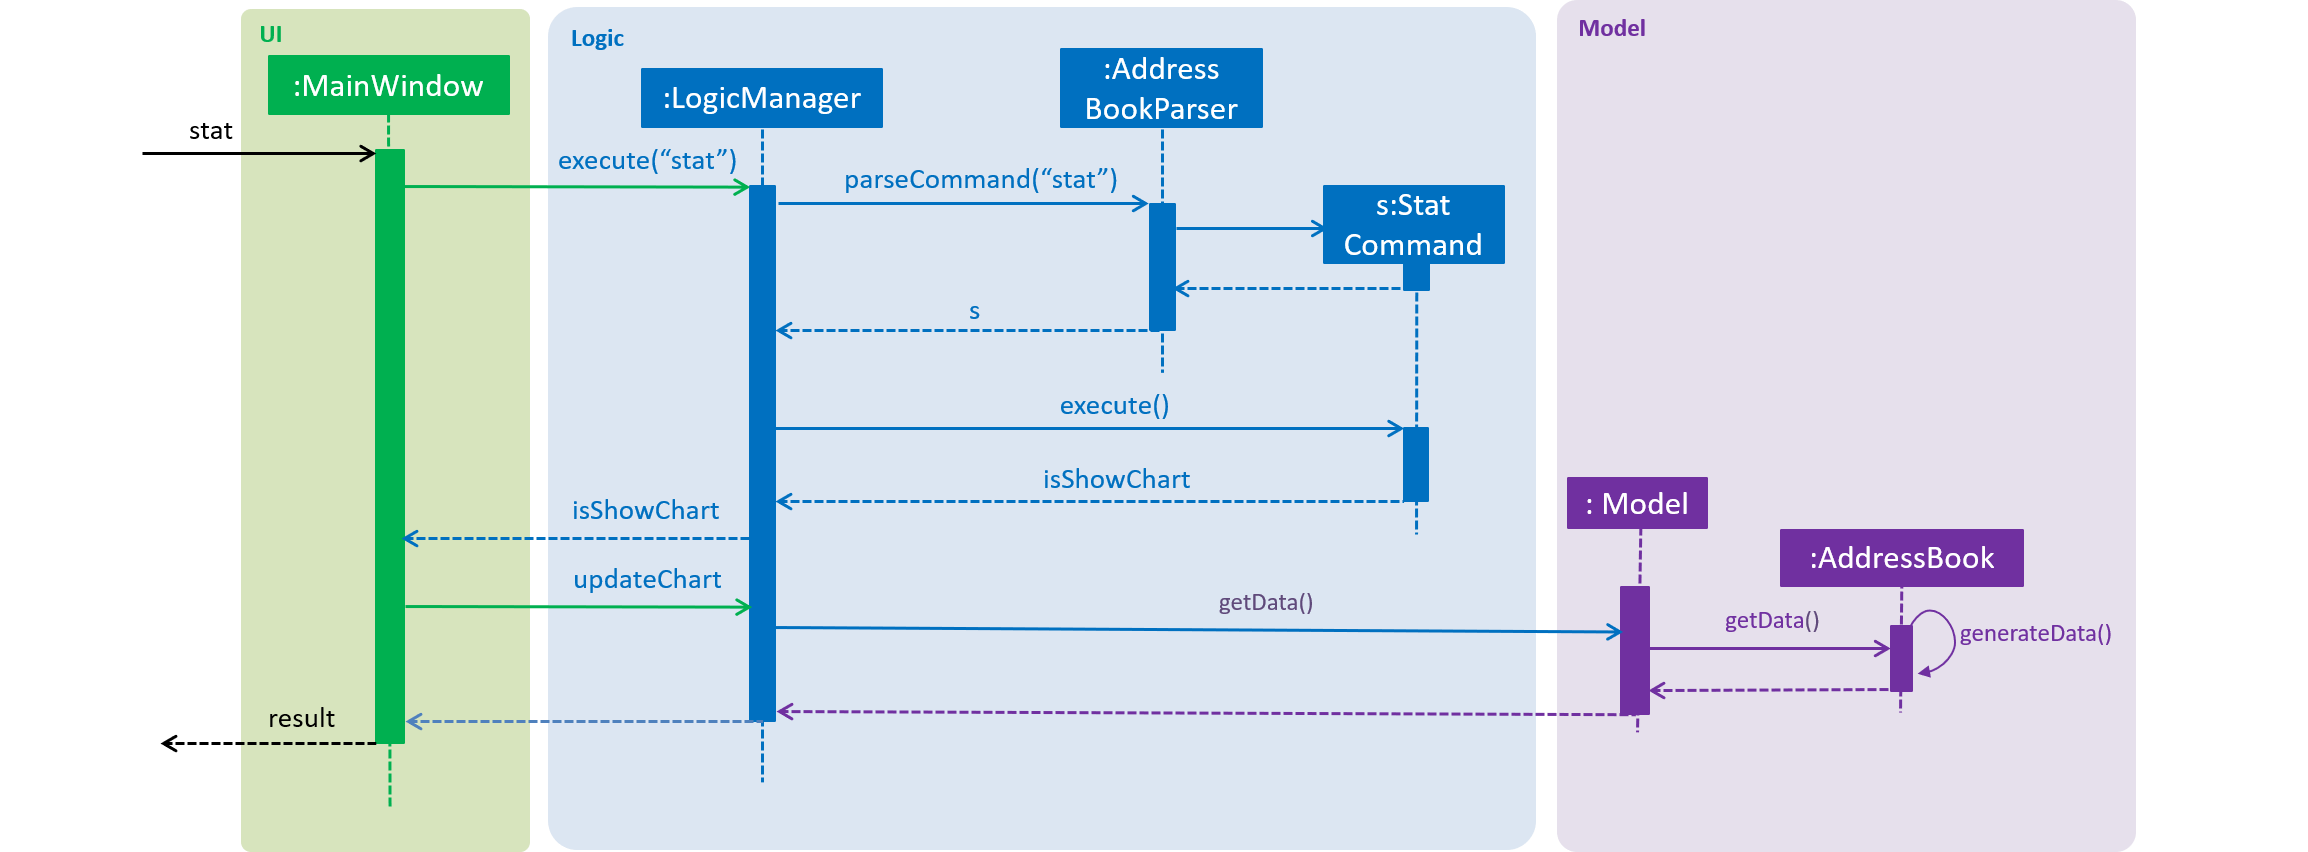
The Statistic feature is facilitated by AddressBook. It has three HashMaps, containing the number of each categories in the participants' age, major and sex. These Map are generated after every call of the
stat command. After command call, these data is loaded into three different pie charts and shown on the UI.
The following sequence diagram show hows the 'stat' command works in details :

stat is executedDesign Consideration
Aspect: How to update the data of the AddressBook
| Alternatives | Pros | Cons |
|---|---|---|
Use a loop to loop through the |
Easy to implement, guaranteed to get the correct data every time |
Takes longer time and more computational power to get the result. |
Update charts data after each commands that modify it. |
Quick runtime, does not require much changes to the codebase |
We must ensure that the data is updated after each command. |
Since this function is unlikely to be used many times and the number of participants in a camp is not too large, the drawbacks to the first alternative are acceptable.
Show participant statistic
-
Show pie charts of participants' age, major and sex
-
Prerequisites: List all participants using the
listcommand. Multiple participants in the list. -
Test case:
stat
Expected: Three pie charts are shown on the GUI with labels for each one. -
Test case:
clear
stat
Expected: Error details shown in the result box.
-
Save pie charts to image files
-
Show pie charts of participants' age, major and sex
-
Prerequisites: List all participants using the
listcommand. Multiple participants in the list. -
Test case:
stat
save_c File Name
Expected: Open chart folder to see three PNG files name "File Name_age", "File Name_major" ,and "File Name_sex" -
Test case:
clear
stat
Expected: Error details shown in the result box.
-